How to download waveform data
Start with web-services
FDSN (Federation of Digital Seismograph Networks) web-services are the most convenient way to access publicly available seismic (and infrasound) waveform data. The FDSN is a global organization which is comprised of groups responsible for the installation and maintenance of seismic stations. Members of the FDSN operate at least one broadband seismic station and agree to provide free and open access to their data. This cooperation leads to a further advancement of earth science and the study of global seismic activity, in particular.
Waveform and metadata from European waveform stations is securely archived within the frameworks of EIDA (European Integrated Data Archive). EIDA is an initiative within ORFEUS (Observatories and Research Facilities for European Seismology), which is operated under the umbrella of EPOS (European Plate Observing System).
Webservices are the easiest way download data from archives such as ORFEUS EIDA. The requests are resolved from URLs that return raw waveform data or station metadata. These requests via URL can be invoked in your preferred browser, in a dedicated command line tool, or through software packages like ObsPy or fdsnws_fetch. The data are requested by querying a webservice with a standardized syntax which consists of the webservice address followed by a service label finalized by one or more option-value pairs that represent the request options that are initialized by a question mark.
Following lines will provide you with some examples of how to download seismic or infrasound data using different methods.
The 2019 Ridgecrest earthquake observed by the PS19 station in Germany:
In this data access example we take a look at the 2019 Ridgecrest earthquake that occurred on the 6th of July, 2019 at 03:19:52 (UTC) in California, US.
Waveforms from this event were recorded on the German Primary station PS19/GERES in the south-eastern part of Germany.
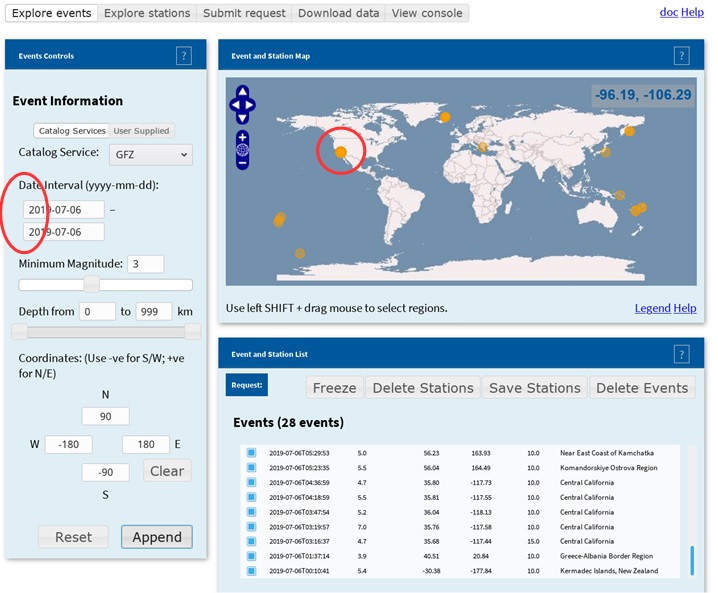
Based on rather course information you may look up the global events in your favoured webbrowser by using the EIDA service e.g. on http://eida.gfz-potsdam.de/webdc3/
By editing the date interval fields on the left of the form and hitting “search” at the bottom left, the site identifies 28 events on that day including events in California.
Selecting this line (by unselecting all others, focusses on the single event.
By moving to the next TAB “Explore stations” of the user interface, one needs to know some Information on the observation station. PS19 is a station in the German regional seismic network, which has the code GR and was established in 1976. Therefore, you have to look for the network code “GR” on that TAB. Pressing “search” at the bottom will list all stations within this network, which have data from the time of this event.
This includes the station codes GEA1 to GED9, which identify the seismic sensors of PS19.
Again, the stations can be selected or deselected in the list.
Moving to the “submit request” TAB of the user interface, you can trigger the generation and download of (a) data file(s). On the left a time window can be specified in order to limit or expand the amount (duration) of data collected in the file(s) and a file format can be chosen. You may leave the defaults for a start. For an event close to the station the option “before” and “after origin time” can be used. For a distant event (1000s of kilometers) the option “P/Pdiff” or “S/Sdiff” should be selected. This option relates the start and end of the time window to the predicted arrival times of the P/Pdiff or S/Sdiff waves, respectively.
Pressing “submit” at the bottom lets the database collect the data and prepare a file for download.


Download via REST-interface
The procedure using the webinterface in the browser, gives a good overview of the data organization, structure and naming conventions. However, it is tedious for data requests by software. For this purpose, a REST API is available, which provides the same functionality.

For example, the following URL will download the waveform data from the event for all elements of the seismic array PS19/GERES:
The query parameters in the URL are:
- "station=GE??" for PS19
- "channel=SHZ" for all PS19/GERES Short-period High-gain Vertical-component (Z) seismometer array elements,
Alternative one could use:
- "station=I26*"
- "channel=BDF" for all IS26 infrasound array elements
The URL could be entered into the browser’s address-line or used in software or on the commandline with tools like wget:
>> wget “http://eida.bgr.de/fdsnws/dataselect/1/query?station=GE??
&channel=SHZ&starttime=2019-07-06T03:30:00&endtime=2019-07-06T03:40:00”
(Note, in this case quotes are necessary to keep the shell from breaking up the query-string)
Station Meta-Data
In order to convert the raw data to properly scaled quantities, the station meta-data are needed, which (among other information) contain information about the response function of the sensor at the time of data collection.
The meta-data can be collected via a similar API, e.g. via following url:
http://eida.bgr.de/fdsnws/station/1/query?station=GE??&channel=SHZ
&starttime=2019-07-06T03:30:00
&endtime=2019-07-06T03:40:00&level=response
For more information on syntax, options and available stations, please take a closer look at following webpages:
The Python-Way
Another method to download data or view MiniSEED files stored locally is by using dedicated software solutions, such as for example ObsPy (https://www.obspy.org). ObsPy is an open-source project dedicated to provide a Python framework for processing seismological data.
For further information and installation instructions please visit https://docs.obspy.org/. In this example we download raw waveform and station metadata from the German infrasound array I26DE, which is collocated to the station PS19/GERES (see above).
Here we want to look at infra-sound signals caused by the accidental explosion in the port of Beirut, on the 4th of August 2020, at 15:08 UTC. Signals arrived at the station I26DE after around 2 hours after traveling more than 2000 km. To access the raw signals please first install ObsPy and then execute following commands in a python console:
from obspy.core import UTCDateTime
from obspy.clients.fdsn import Client
client = Client('BGR')
t1 = UTCDateTime('2020-08-04T17:10:00')
t2 = t1 + 1200
raw_data = client.get_waveforms(network='GR',station='I26*',location='',channel='BDF',starttime=t1,endtime=t2)
To further download station information execute:
xml = client.get_stations(network='GR',station='I26*',
channel='BDF',starttime=t1,endtime=t2,level='response')
To scale the data using the station’s meta-data:
data = raw_data.remove_response(inventory=xml)
To filter, trim and plot the data execute:
data.filter('bandpass',freqmin=0.1,freqmax=1.0)
data.trim(t1+60,t2-60)
data.plot()
Which gives:

Data files like those downloaded via the web-interface can be read for plotting and processing via the two-liner
import obspy
raw_data = obspy.core.read(“path_to_file”)
Further information on how to process and store retrieved data can be found on https://docs.obspy.org/.